> For the complete documentation index, see [llms.txt](https://hulining.gitbook.io/prometheus/llms.txt). Markdown versions of documentation pages are available by appending `.md` to page URLs; this page is available as [Markdown](https://hulining.gitbook.io/prometheus/v2.18/guides/node-exporter.md).
# 使用 Node Exporter 监控 Linux 主机指标
Prometheus [**Node Exporter**](https://github.com/prometheus/node_exporter) 公开了各种与硬件和内核相关的指标。
在本指南中,你将:
* 在 `localhost` 启动 Node Exporter
* 在 `localhost` 上配置 Prometheus 实例,该实例已配置为从正在运行的 Node Exporter 中采集指标
{% hint style="info" %}
NOTE: Prometheus Node Exporter 适用于 \*nix 系统,Windows 中使用 [WMI exporter](https://github.com/martinlindhe/wmi_exporter) 具有类似的用途。
{% endhint %}
## 安装并运行 Node Exporter
Prometheus Node Exporter 是一个静态二进制文件,您可以通过 tartar 安装。 从 Prometheus [下载页面](https://prometheus.io/download#node_exporter) 下载后,将其解压缩并运行:
```bash
wget https://github.com/prometheus/node_exporter/releases/download/v*/node_exporter-*.*-amd64.tar.gz
tar xvfz node_exporter-*.*-amd64.tar.gz
cd node_exporter-*.*-amd64
./node_exporter
```
您应该看到这样的输出表明 Node exporter 正在运行,并且在端口 9100 上公开了指标:
```
INFO[0000] Starting node_exporter (version=0.16.0, branch=HEAD, revision=d42bd70f4363dced6b77d8fc311ea57b63387e4f) source="node_exporter.go:82"
INFO[0000] Build context (go=go1.9.6, user=root@a67a9bc13a69, date=20180515-15:53:28) source="node_exporter.go:83"
INFO[0000] Enabled collectors: source="node_exporter.go:90"
INFO[0000] - boottime source="node_exporter.go:97"
...
INFO[0000] Listening on :9100 source="node_exporter.go:111"
```
## Node Exporter 数据指标
安装并运行 Node Exporter之后,您可以通过对 `/metrics` 端点进行 cURL 验证来确认公开的数据指标:
```bash
curl http://localhost:9100/metrics
```
您应该看到如下输出:
```
# HELP go_gc_duration_seconds A summary of the GC invocation durations.
# TYPE go_gc_duration_seconds summary
go_gc_duration_seconds{quantile="0"} 3.8996e-05
go_gc_duration_seconds{quantile="0.25"} 4.5926e-05
go_gc_duration_seconds{quantile="0.5"} 5.846e-05
# etc.
```
现在,Node Exporter 公开了 Prometheus 可以采集的指标,包括更下方输出中的各种系统指标(以`node_`为前缀)。要查看这些指标(以及帮助和类型信息:
```bash
curl http://localhost:9100/metrics | grep "node_"
```
## 配置 Prometheus 实例
需要正确配置本地运行的 Prometheus 实例,才能访问 Node Exporter 指标。
下面的 [`scrape_config`](/prometheus/v2.18/prometheus/configuration/configuration.md#scrape_config) 配置块 (在 `prometheus.yml` 配置文件中) 将告诉 Prometheus 实例通过 `localhost:9100` 从 Node Exporter 中进行数据采集:
```yaml
scrape_configs:
- job_name: 'node'
static_configs:
- targets: ['localhost:9100']
```
要安装 Prometheus, [下载最新版本](https://prometheus.io/download)并解压它:
```bash
wget https://github.com/prometheus/prometheus/releases/download/v*/prometheus-*.*-amd64.tar.gz
tar xvf prometheus-*.*-amd64.tar.gz
cd prometheus-*.*
```
安装 Prometheus 后,您可以使用`--config.file` 标志指向上面创建的 Prometheus 配置:
```bash
./prometheus --config.file=./prometheus.yml
```
## 通过 Prometheus 表达式浏览器检索 Node Exporter 指标
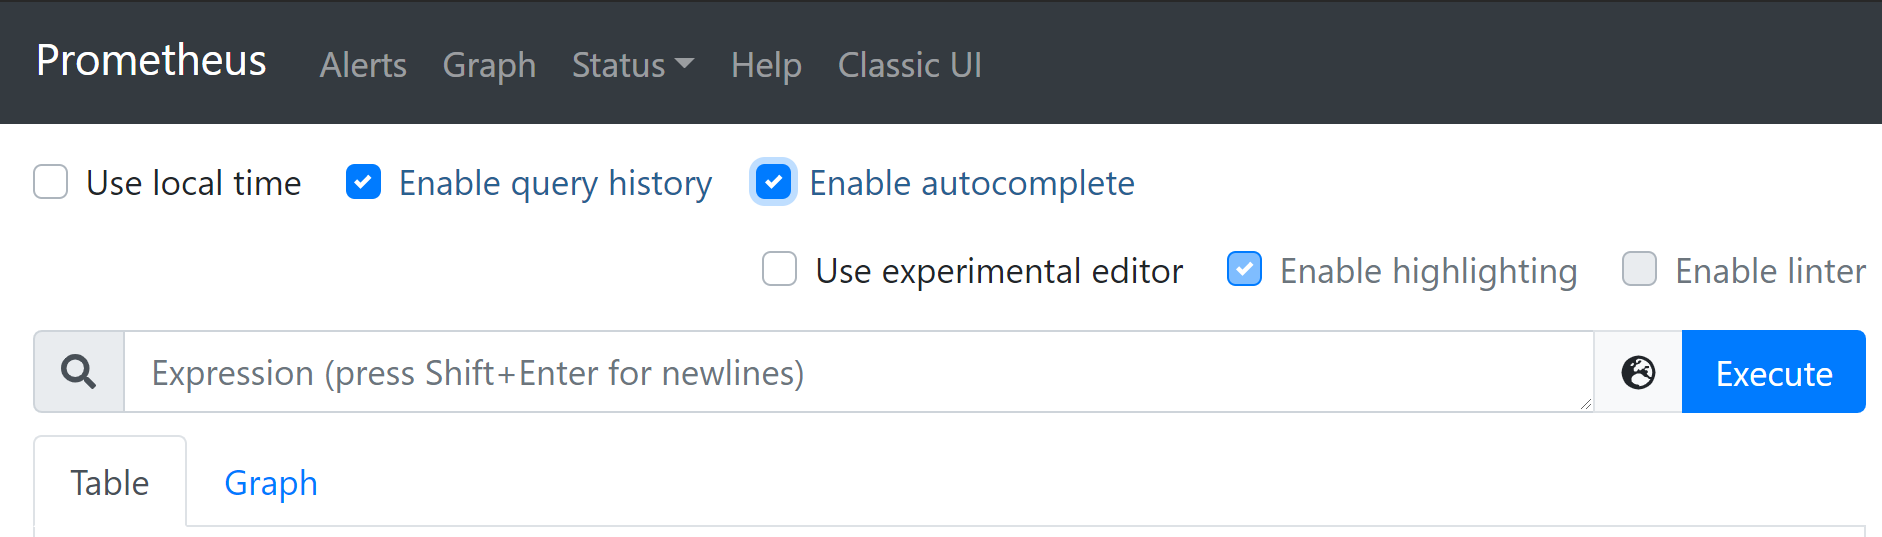
现在,Prometheus 正在从正在运行的 Node Exporter 实例中采集指标,您可以使用 Prometheus UI(又名[表达式浏览器](/prometheus/v2.18/visualization/browser.md))浏览这些指标。在您的浏览器中导航至 `localhost:9090/graph`。然后使用页面顶部的主表达式栏输入表达式。表达式栏如下所示:
Node Exporter 的数据指标以 `node_` 为前缀,并包括诸如 `node_cpu_seconds_total` 和 `node_exporter_build_info` 之类的数据指标。
单击下面的链接以查看一些示例指标:
| Metric | Meaning |
| ------------------------------------------------------------------------------------------------------------------------------------------------------------------------------------- | -------------------------------------- |
| [`rate(node_cpu_seconds_total{mode="system"}[1m])`](http://localhost:9090/graph?g0.range_input=1h\&g0.expr=rate\(node_cpu_seconds_total%7Bmode%3D%22system%22%7D%5B1m%5D\)\&g0.tab=1) | 过去一分钟内,系统每秒花费的平均 CPU 时间(以 seconds 为单位) |
| [`node_filesystem_avail_bytes`](http://localhost:9090/graph?g0.range_input=1h\&g0.expr=node_filesystem_avail_bytes\&g0.tab=1) | 可用的文件系统空间(以 bytes 为单位) |
| [`rate(node_network_receive_bytes_total[1m])`](http://localhost:9090/graph?g0.range_input=1h\&g0.expr=rate\(node_network_receive_bytes_total%5B1m%5D\)\&g0.tab=1) | 过去一分钟内,平均每秒收到的网络流量(以 bytes 为单位) |
---
# Agent Instructions
This documentation is published with GitBook. GitBook is the documentation platform designed so that both humans and AI agents can read, navigate, and reason over technical content effectively. Learn more at gitbook.com.
## Querying This Documentation
If you need additional information that is not directly available in this page, you can query the documentation dynamically by asking a question.
Perform an HTTP GET request on the current page URL with the `ask` query parameter:
```
GET https://hulining.gitbook.io/prometheus/v2.18/guides/node-exporter.md?ask=
```
The question should be specific, self-contained, and written in natural language.
The response will contain a direct answer to the question and relevant excerpts and sources from the documentation.
Use this mechanism when the answer is not explicitly present in the current page, you need clarification or additional context, or you want to retrieve related documentation sections.