# Grafana 对 Prometheus 的支持
[Grafana](http://grafana.org/) 支持查询 Prometheus。Grafana 从 2.5.0(2015-10-28)开始包含 Prometheus 的数据源。
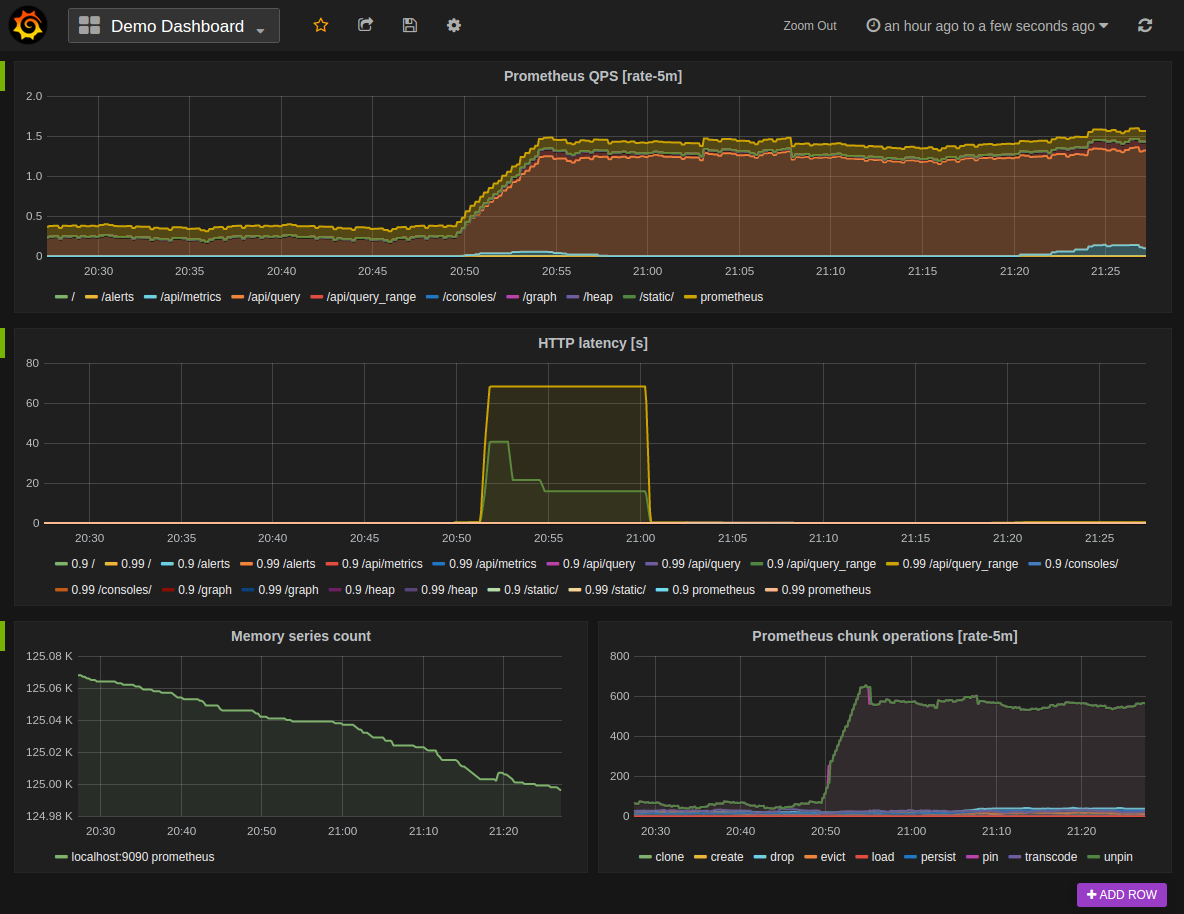
下图显示了示例 Grafana 仪表盘,该仪表盘查询 Prometheus 以获取数据:
## 安装
要安装 Grafana,请参阅 [Grafana 官方文档](https://grafana.com/grafana/download/)
## 使用
默认情况下,Grafana 监听在 。默认登录用户是 "admin"/"admin"。
### 创建 Prometheus 数据源
要创建一个 Prometheus 数据源:
1. 单击 Grafana 图标以打开侧边栏菜单
2. 在侧边栏中单击 "Data Sources"
3. 单击 "Add New"
4. 类型选择为 "Prometheus"
5. 设置正确的 Prometheus 服务 URL 地址(如,`http://localhost:9090/`)
6. 根据需要调整其它数据源设置(如,关闭代理访问)
7. 单击 "添加" 以保存新的数据源

### 创建 Prometheus 图表
按照以下方法添加一个新的 Grafana 图表:
1. 单击图表标题,然后点击 "Edit"
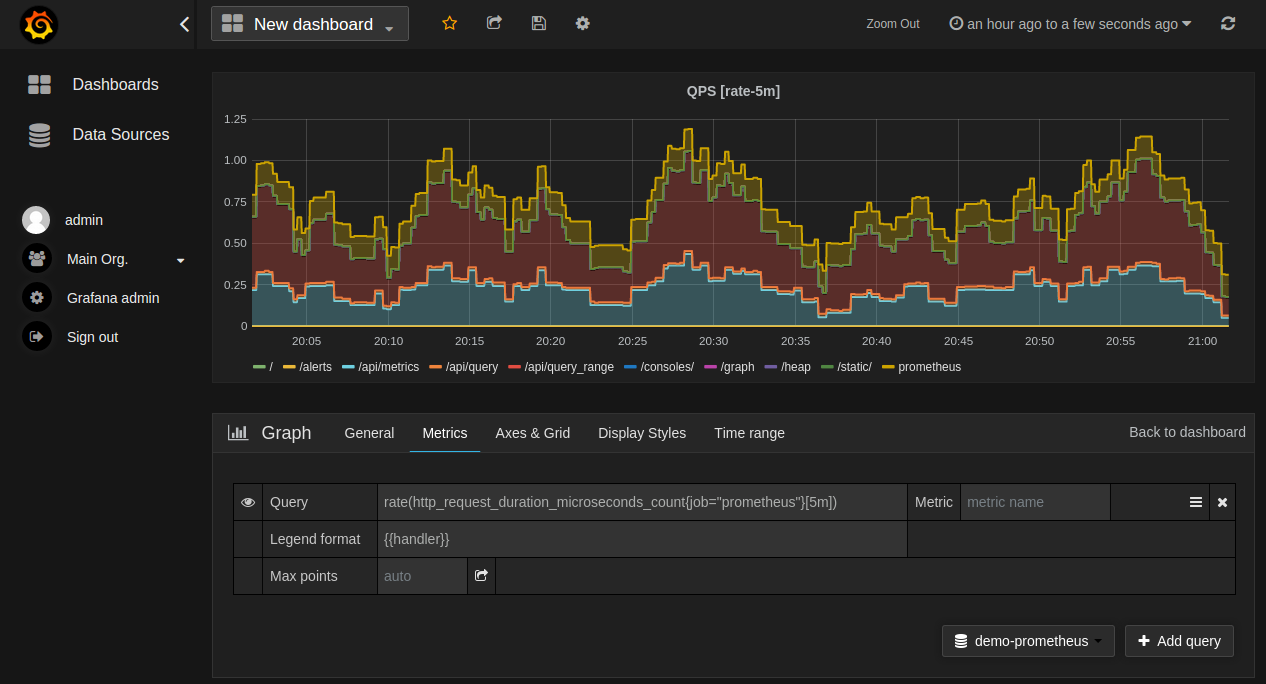
2. 在 "Mettrics" 标签下,选择您的 Prometheus 数据源(右下)
3. 在 "Query" 字段中输入 Prometheus 表达式,同时使用 "Metric" 字段通过自动补全查找数据指标
4. 要格式化时间序列的图例名称,请使用 "Legend format" 输入。如,要仅显示返回的查询结果的`method`和`status`标签,并用短横线分割,可以使用图例格式字符串`{{method}}-{{status}}`
5. 调整其他图形设置,直到图表可以正常工作为止
下图展示了 Prometheus 图表配置示例:
### 从 Grafana.com 导入预构建的仪表板
Grafana.com 维护着[一组共享仪表盘](https://grafana.com/dashboards),这些仪表盘可以下载并与 Grafana 的独立实例一起使用。 使用 Grafana.com 的 "Filter" 选项仅浏览仪表盘中的 "Prometheus" 数据源。
您需要手动编辑下载的 JSON 文件并修改`datasource`: 映射 Grafana 数据源名称为您的 Prometheus 服务。 使用 "Dashboards" → "Home" → "导入"选项将已编辑的仪表盘文件导入到您安装的 Grafana 中。
---
# Agent Instructions: Querying This Documentation
If you need additional information that is not directly available in this page, you can query the documentation dynamically by asking a question.
Perform an HTTP GET request on the current page URL with the `ask` query parameter:
```
GET https://hulining.gitbook.io/prometheus/visualization/grafana.md?ask=
```
The question should be specific, self-contained, and written in natural language.
The response will contain a direct answer to the question and relevant excerpts and sources from the documentation.
Use this mechanism when the answer is not explicitly present in the current page, you need clarification or additional context, or you want to retrieve related documentation sections.