# 使用 cAdvisor 监控 docker 容器数据指标
[cAdvisor](https://github.com/google/cadvisor)(**c**ontainer **Advisor** 的简写) 分析并公开正在运行的容器的资源使用情况和性能数据。cAdvisor 公开的 Prometheus 指标可以立即使用 。在本指南中,我们将:
* 创建一个本地多容器 [Docker Compose](https://docs.docker.com/compose/)安装,包括分别运行 Prometheus,cAdvisor 和 [Redis](https://redis.io/) 服务的容器.
* 检查由 Redis 容器产生,由 cAdvisor 收集并由 Prometheus 采集的一些数据指标
## Prometheus 配置
首先,您需要[配置](/prometheus/prometheus/configuration/configuration.md) Prometheus 从 cAdvisor 采集指标。创建一个 `prometheus.yml` 文件,并使用以下配置填充它:
```yaml
scrape_configs:
- job_name: cadvisor
scrape_interval: 5s
static_configs:
- targets:
- cadvisor:8080
```
## Docker Compose 配置
我们需要创建一个 Docker Compose [配置](https://docs.docker.com/compose/compose-file/),该配置指定我们安装的是哪些容器,以及每个容器公开哪些端口,使用哪些卷等等。
在创建 `prometheus.yml` 文件的同一文件夹中,创建一个 `docker-compose.yml`文件,并使用以下Docker Compose配置填充它:
```yaml
version: '3.2'
services:
prometheus:
image: prom/prometheus:latest
container_name: prometheus
ports:
- 9090:9090
command:
- --config.file=/etc/prometheus/prometheus.yml
volumes:
- ./prometheus.yml:/etc/prometheus/prometheus.yml:ro
depends_on:
- cadvisor
cadvisor:
image: google/cadvisor:latest
container_name: cadvisor
ports:
- 8080:8080
volumes:
- /:/rootfs:ro
- /var/run:/var/run:rw
- /sys:/sys:ro
- /var/lib/docker/:/var/lib/docker:ro
depends_on:
- redis
redis:
image: redis:latest
container_name: redis
ports:
- 6379:6379
```
此配置指示 Docker Compose 运行三个服务,每个服务对应一个 Docker 容器:
1. `prometheus` 服务使用本地 `prometheus.yml` 配置文件(通过 volumes 参数导入到容器中)
2. `cadvisor` 服务公开端口 8080(cAdvisor 数据指标的默认端口)并挂载了各种本地卷(`/`, `/var`, `/run`等)
3. `redis` 服务是标准的 Redis 服务。cAdvisor 将自动从该容器收集容器指标,即无需任何进一步配置。
使用如下命令运行安装
```bash
docker-compose up
```
如果 Docker Compose 成功启动了三个容器,则应该看到如下输出:
```
prometheus | level=info ts=2018-07-12T22:02:40.5195272Z caller=main.go:500 msg="Server is ready to receive web requests."
```
您可以使用 `ps` 命令验证三个容器都在运行
```bash
docker-compose ps
```
您将看到类似于如下的输出
```
Name Command State Ports
----------------------------------------------------------------------------
cadvisor /usr/bin/cadvisor -logtostderr Up 8080/tcp
prometheus /bin/prometheus --config.f ... Up 0.0.0.0:9090->9090/tcp
redis docker-entrypoint.sh redis ... Up 0.0.0.0:6379->6379/tcp
```
## Exploring the cAdvisor web UI
您可以通过 `http://localhost:8080` 访问 cAdvisor [Web UI](https://github.com/google/cadvisor/blob/master/docs/web.md)。您可以在 `http://localhost:8080/docker/` 的浏览指定已经安装的 Docker 容器的统计信息和图表。例如,可以在 `http://localhost:8080/docker/redis` 上访问 Redis 容器的,在 `http://localhost:8080/docker/prometheus` 上访问 Prometheus 的,等等
## 在表达式浏览器中检索数据指标
cAdvisor Web UI 是用于浏览 cAdvisor 监控服务的接口,但是它不提供用于浏览容器指标的界面。 为此,我们需要 Prometheus 表达式浏览器,该浏览器可从 `http://localhost:9090/graph` 访问。您可以在表达式栏中输入 Prometheus 表达式,如下所示:
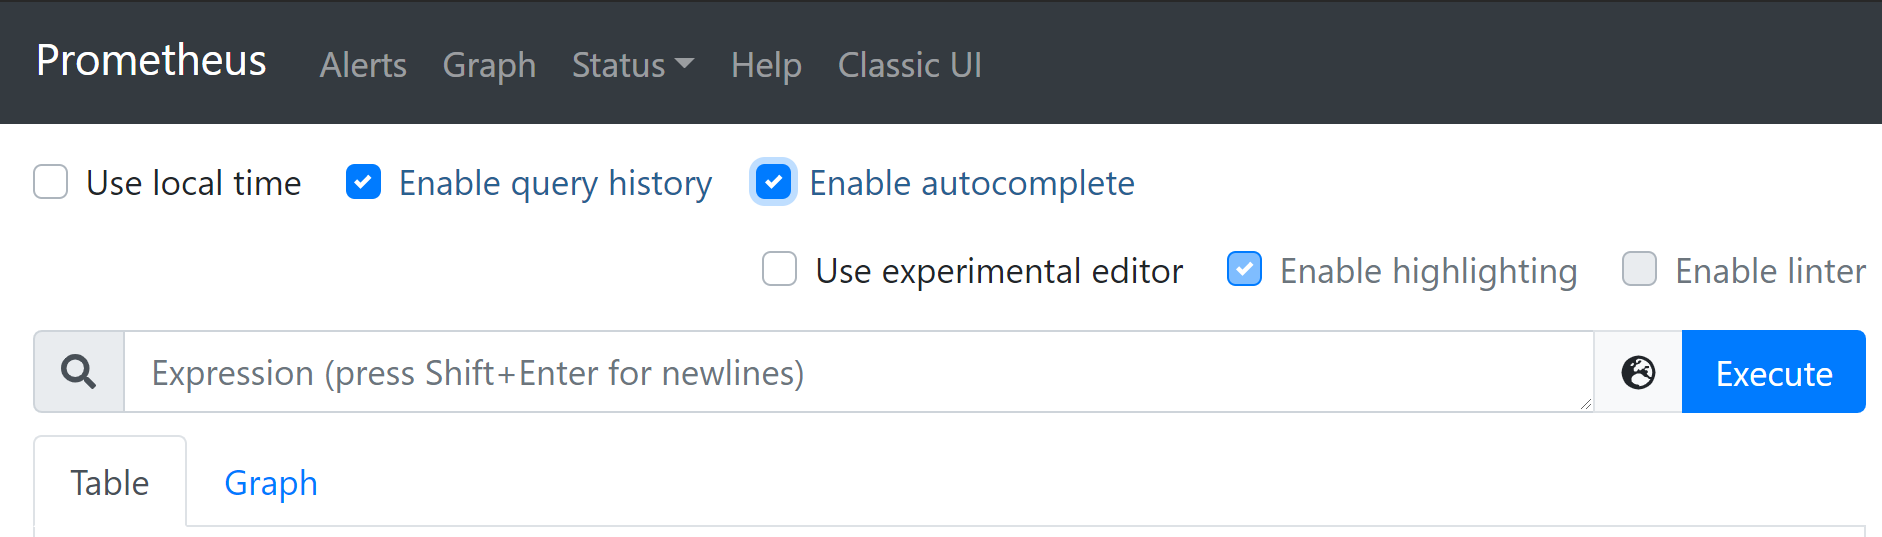
让我们开始检索`container_start_time_seconds`指标,该指标记录了容器的启动时长(以秒为单位)。您可以使用`name=""`表达式按名称选择特定的容器。容器名称对应于 Docker Compose 配置中的 `container_name` 参数。例如,[`container_start_time_seconds{name="redis"}`](http://localhost:9090/graph?g0.range_input=1h\&g0.expr=container_start_time_seconds%7Bname%3D%22redis%22%7D\&g0.tab=1) 表达式显示 `redis` 容器启动时长。
{% hint style="info" %}
NOTE: 可以在 [cAdvisor 文档](https://github.com/google/cadvisor/blob/master/docs/storage/prometheus.md)中找到公开给 Prometheus 的 cAdvisor 收集的容器数据指标的的完整列表。
{% endhint %}
## 其它表达式
下表列出了其他一些示例表达式
| Expression | Description | For |
| --------------------------------------------------------------------------------------------------------------------------------------------------------------------------------------------------------- | -------------------------------------------------------------- | ---------- |
| [`rate(container_cpu_usage_seconds_total{name="redis"}[1m])`](http://localhost:9090/graph?g0.range_input=1h\&g0.expr=rate\(container_cpu_usage_seconds_total%7Bname%3D%22redis%22%7D%5B1m%5D\)\&g0.tab=1) | [cgroup](https://en.wikipedia.org/wiki/Cgroups) 最近一分钟的 CPU 使用率 | `redis` 容器 |
| [`container_memory_usage_bytes{name="redis"}`](http://localhost:9090/graph?g0.range_input=1h\&g0.expr=container_memory_usage_bytes%7Bname%3D%22redis%22%7D\&g0.tab=1) | cgroup 的内存使用率(以 bytes 为单位) | `redis` 容器 |
| [`rate(container_network_transmit_bytes_total[1m])`](http://localhost:9090/graph?g0.range_input=1h\&g0.expr=rate\(container_network_transmit_bytes_total%5B1m%5D\)\&g0.tab=1) | 容器在最近一分钟内每秒通过网络传输的字节数 | 所有容器 |
| [`rate(container_network_receive_bytes_total[1m])`](http://localhost:9090/graph?g0.range_input=1h\&g0.expr=rate\(container_network_receive_bytes_total%5B1m%5D\)\&g0.tab=1) | 容器在最近一分钟内每秒通过网络接收的字节数 | 所有容器 |
## 小结
在本指南中,我们使用 Docker Compose 运行了三个单独的容器: Prometheus 容器从 cAdvisor 容器中采集指标,而 cAdvisor 容器又收集了 Redis 容器生成的指标。然后,我们使用 Prometheus 表达式浏览器检索了少数 cAdvisor 容器指标。
---
# Agent Instructions: Querying This Documentation
If you need additional information that is not directly available in this page, you can query the documentation dynamically by asking a question.
Perform an HTTP GET request on the current page URL with the `ask` query parameter:
```
GET https://hulining.gitbook.io/prometheus/guides/cadvisor.md?ask=
```
The question should be specific, self-contained, and written in natural language.
The response will contain a direct answer to the question and relevant excerpts and sources from the documentation.
Use this mechanism when the answer is not explicitly present in the current page, you need clarification or additional context, or you want to retrieve related documentation sections.